TIP Academy
TIP Academy
Seth Klarman
Stock Portfolio
Seth Klarman
Stock Portfolio
Below is the current stock portfolio and sector weightings of Seth Klarman. This information includes his number of shares, portfolio weight, and the latest value of his stock picks to date. Note: The data presented here are updated every quarter.

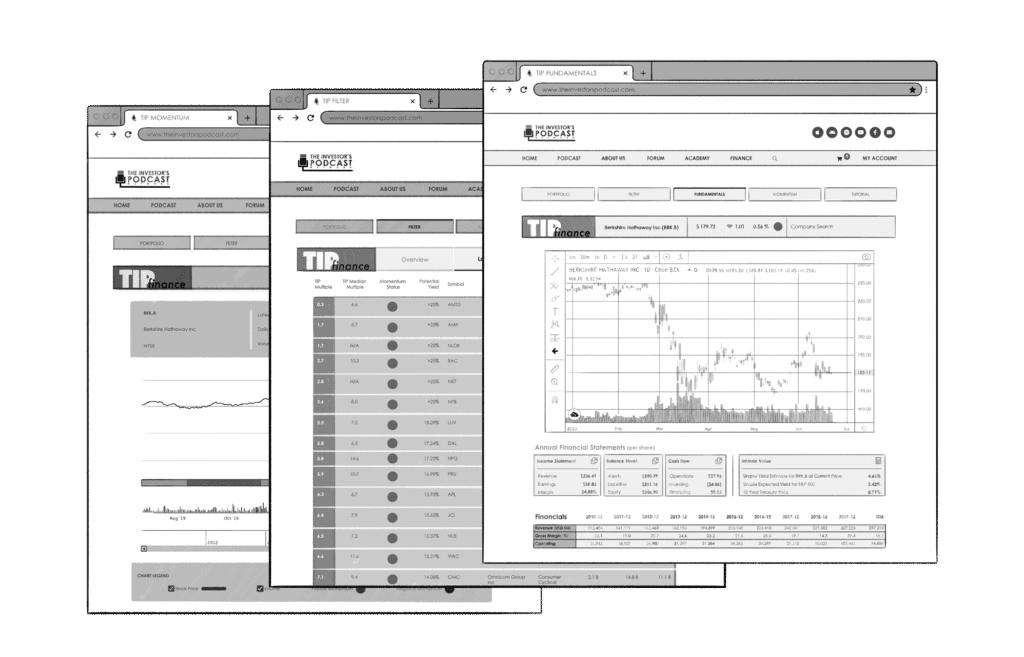
TIP FINANCE
TIP Finance is a great way to track your own portfolio, to monitor changes to legend investors’ investments, and for finding your next great stock pick and calculating its intrinsic value. Plus so much more! Start using TIP Finance today (for free) to become a better investor like thousands of others already have.
TIP FINANCE
TIP Finance is a great way to track your own portfolio, to monitor changes to legend investors’ investments, and for finding your next great stock pick and calculating its intrinsic value.
Plus so much more!
Start using TIP Finance today (for free) to become a better investor like thousands of others already have.
SECTOR WEIGHTINGS (%)
Get smarter about valuing businesses in just a few minutes each week.
Get the weekly email that makes understanding intrinsic value
easy and enjoyable, for free.
CURRENT PORTFOLIO
(As of February 13, 2026)
| Ticker | Company | % Portfolio | Number of Shares | Value ($1,000) |
|---|---|---|---|---|
| QSR | Restaurant Brands Intl Inc | 10.44% | 8,080 | 551,325 |
| AMZN | Amazon Com Inc | 9.28% | 2,121 | 489,659 |
| WTW | Willis Towers Watson Plc Ltd | 8.45% | 1,357 | 446,108 |
| ELV | Elevance Health Inc Formerly | 8.43% | 1,269 | 444,954 |
| UNP | Union Pac Corp | 7.13% | 1,627 | 376,416 |
| WCC | Wesco Intl Inc | 6.58% | 1,418 | 347,103 |
| GOOG | Alphabet Inc | 6.46% | 1,087 | 341,157 |
| FIS | Fidelity Natl Information Sv | 5.67% | 4,503 | 299,323 |
| DG | Dollar Gen Corp New | 5.19% | 2,062 | 273,881 |
| LBTYA | Liberty Global Ltd | 4.81% | 22,965 | 253,744 |
| FERG | Ferguson Enterprises Inc | 4.80% | 1,137 | 253,138 |
| EXP | Eagle Matls Inc | 4.64% | 1,185 | 244,967 |
| GPC | Genuine Parts Co | 3.46% | 1,486 | 182,729 |
| FISV | Fiserv Inc | 2.80% | 2,200 | 147,774 |
| CRH | Crh Plc | 2.54% | 1,072 | 133,905 |
| HLF | Herbalife Ltd | 2.26% | 9,259 | 119,359 |
| MOH | Molina Healthcare Inc | 2.05% | 625 | 108,463 |
| AERO | Grupo Aeromexico Sab De Cv | 2.02% | 4,855 | 106,620 |
| GDS | Gds Hldgs Ltd | 2.01% | 3,044 | 106,264 |
| COLD | Americold Realty Trust Inc | 0.85% | 3,475 | 44,697 |
| -–- | Others | 0.13% | 257 | 7,004 |
| -–- | Asset Under Management | 100.00% | 75,092 | 5,278,590 |

COURSES & TOOLS
Enjoy an abunance of materials and exclusive tools that can help you throught your investing journey!