Intrinsic Value Assessment Of HCA Healthcare Inc (HCA)
By David J. Flood From The Investor’s Podcast Network | 26 September 2017
INTRODUCTION
HCA Healthcare Inc. (HCA) is one of the leading healthcare providers in the U.S. with over 27 million patient encounters each year and a workforce of over 240,000 employees. The company is currently ranked 63rd on the Fortune 500 list. Since its IPO back in March 2011, it has generated $28.4 Billion in cash flows from operations, distributing $3.2 billion back to shareholders in the form of special dividends and allocating $9.9 billion to share buybacks. Over the past year, the company has traded between a low of $67 and a high of $91, and as of writing, its market price sits at $78. Is HCA undervalued at the current price?

HCA’S INTRINSIC VALUE
To determine the intrinsic value of HCA, we first need to crunch some numbers and then make some reasonable estimates for the future of the company. We’ll begin by looking at the company’s historical free cash flow since this is the true earnings that management can choose to reinvest for growth or distribute back to shareholders in the form of dividends and share buybacks. Below is a chart that shows HCA’s free cash flow growth for the past ten years.

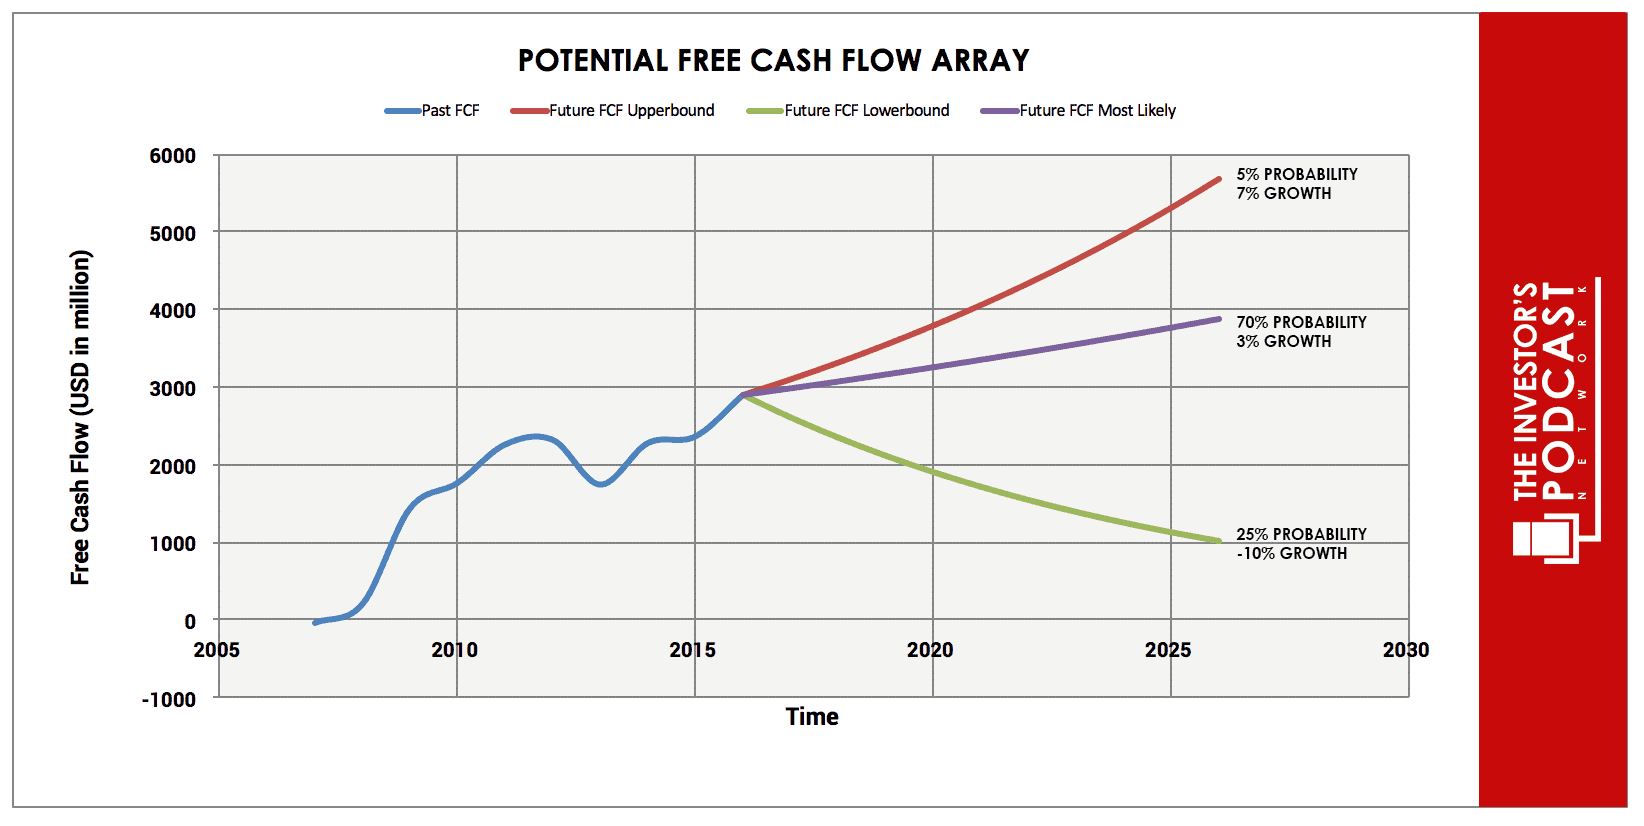
As can be seen, there has been a reasonably stable trend in the growth of free cash flow, but is this level of growth likely to continue in the future? Taking the earnings figures for the last ten years, HCA has been growing at approximately 14%, but future projections must be conservative since such high levels are unlikely to be replicated. For this reason, it is more prudent to use revenue growth since this tends to be far more stable over longer periods of time. Revenue growth for the last ten years has been approximately 4%, a much more realistic assumption no doubt, but we must also consider the possibility of growth stagnating or contracting. Below is a chart depicting an array of potential future free cash flow projections.

The above chart represents three separate free cash flow projections. The upper bound rate is compounding at 7% annually. This higher growth rate is highly unlikely and is assigned a probability of 5% of occurring. The most likely rate of free cash flow growth is the middle line at 3% annually per year. This moderate growth rate has a 70% probability of occurring. Finally, the pessimistic cash flow projection is a -10% rate per year. This projection is assigned a 25% probability of occurring.
Assuming the assigned probabilities accurately model what might happen, HCA could yield 9.4% annually over the next ten years if purchased at the current market price of $77 per share.
It is now worth looking at another method of valuation to see if the company is indeed priced to return the rate predicted by the free cash flow model employed earlier. HCA’s earnings yield, which is the inverse of its EV/EBIT ratio, is currently 10.71%. This valuation metric is in line with that of the free cash flow model suggesting that the company may well achieve the projected return. Using the P/S ratio, a commonly used metric, to see if it confirms the assertion that HCA offers good value at the current price. The company is currently priced at a P/S of 0.72, which suggests it is indeed undervalued. The P/S ratio is useful in that, as mentioned earlier, revenues tend to be far more stable than earnings and so this adds more weight to the investment thesis. In general, most of the company’s financials point to a company that’s been exposed to excessive selling in the market.
HCA’S COMPETITIVE ADVANTAGES
HCA possesses several competitive advantages which enable it to generate high returns on capital and a strong free cash flow.
- Economies and efficiencies of scale. The sheer size of the company’s operations provides it with economies and efficiencies of scale meaning it possesses greater purchasing power with its suppliers and can negotiate more favorable contracts with its clients. This translates to the company achieving a 5-year average return on assets of 8.28% and a 5-year average return on investment of 10.84%, both of which are the highest amongst its peers.
- The diversity of business. Due to the company’s diverse business mix, it is better prepared to deal with any fluctuations arising from reimbursement uncertainty. Given the recent upheaval in the health insurance industry and the ever-present threat of increased government regulation, HCA stands well positioned to manage these risks since it is a fully integrated health service provider. According to the company’s Post 2Q 2017 presentation, HCA ranks either 1stor 2nd in 27 of the 38 studied markets.
- Low labor costs.Within the U.S. healthcare industry, salaries and benefits typically account for over 50% of operating costs. An examination of HCA’s most recent 10-K shows a labor cost/revenue ratio of 45% which is very impressive indeed. To achieve this, the company employs novel techniques to manage labor costs through the development and application of data analytics models. Traditionally, healthcare companies would set workforce levels based upon annual census data. But in an increasingly competitive environment where margins are squeezed, this model has become too inefficient. It has been reported that HCA checks its labor analytics every two hours and adjusts staffing levels based upon productivity targets which are set per four-hour shift. Further, management is assessed on a monthly basis to ensure that staffing levels are managed efficiently and cost-effectively.
HCA’S RISKS
There are a few risks associated with HCA which also should be considered.
- The threat of increased government regulation could result in the company incurring higher operating costs or suffering from a fall in earnings due to lower reimbursements, both of which would materially impact the company’s free cash flow position.
- The company’s Total Debt/Capital ratio currently stands at 1.19, which is significantly higher than its peers. HCA may well be able to manage this debt load through a continued dominance of market share and earnings growth derived from its competitive advantages, but attention should be paid to any weakening in the company’s liquidity position and erosion of market share.
OPPORTUNITY COSTS
Whenever an investment is considered, a person must compare it to other alternatives to weigh the opportunity cost. At present, 10-year treasuries are yielding 2.18%. If we take inflation into account, the real return is likely to be closer to 1%. The S&P 500 Index is currently trading at a Shiller P/E of x 30, meaning it is priced for an earnings yield of 3.3%. HCA, therefore, appears to offer a much better return for investors by about three times as much yield.
MACRO FACTORS
Investors must consider macroeconomic factors that may impact economic and market performance as this could influence investment returns. At present, the S&P is priced at a Shiller P/E of 30. This is over 85% higher than the historical average of 16.8, suggesting markets are at elevated levels. U.S. unemployment figures are at a 30-year low suggesting that the current business cycle is nearing its peak. U.S. private debt/GDP currently stands at 199.6% and is at its highest point since 2009 when the last financial crisis prompted private sector deleveraging. The only time the stock market was priced higher was in 2000 and 1929. Based on these facts, there’s a strong likelihood that the market will perform poorly in the coming years. These short-term factors are likely to impact the long-term projections.
SUMMARY
The long-term prospects for the healthcare industry look promising as populations continue to increase and life expectancy levels rise. According to the CMA, which is a federal agency within the United States Department of Health and Human Services, healthcare spending is projected to grow in the U.S. at a rate of 5.8% over the period of 2014-2024. This should ensure that demand for the products and services which HCA provides will continue to grow. Given the company’s competitive advantages, it is well positioned to deal with any non-market risks which may arise.
To learn more about intrinsic value, check out our comprehensive guide to calculating the intrinsic value of stocks.


