Intrinsic Value Assessment Of Amgen Inc. (AMGN)
By David J. Flood From The Investor’s Podcast Network | 11 December 2017
INTRODUCTION
Amgen Inc. is an American based multinational biopharmaceutical company whose principal business involves the development, manufacture, and sale of pharmaceuticals used in six therapeutic areas, namely cardiovascular disease, oncology, bone health, neuroscience, nephrology, and inflammation. At present, the company stands as one of the world’s largest independent biotechnology companies with a presence established in around 100 countries worldwide. Amgen Inc. is currently a member of the Fortune 500 list with a market cap of $127.3 Billion. Its revenues and free cash flows for FY2016 were around $22.92 Billion and $9.5 Billion respectively. The company’s common stock has fluctuated between a low of $141 and a high of $191 over the past 52 weeks, and currently stands at around $175. Is Amgen Inc. undervalued at the current price?

THE INTRINSIC VALUE OF AMGEN INC.
To determine the intrinsic value of Amgen Inc., we’ll begin by looking at the company’s history of free cash flow. A company’s free cash flow is the true earnings which management can either reinvest for growth or distribute back to shareholders in the form of dividends and share buybacks. Below is a chart of Amgen Inc.’s free cash flow for the past ten years.

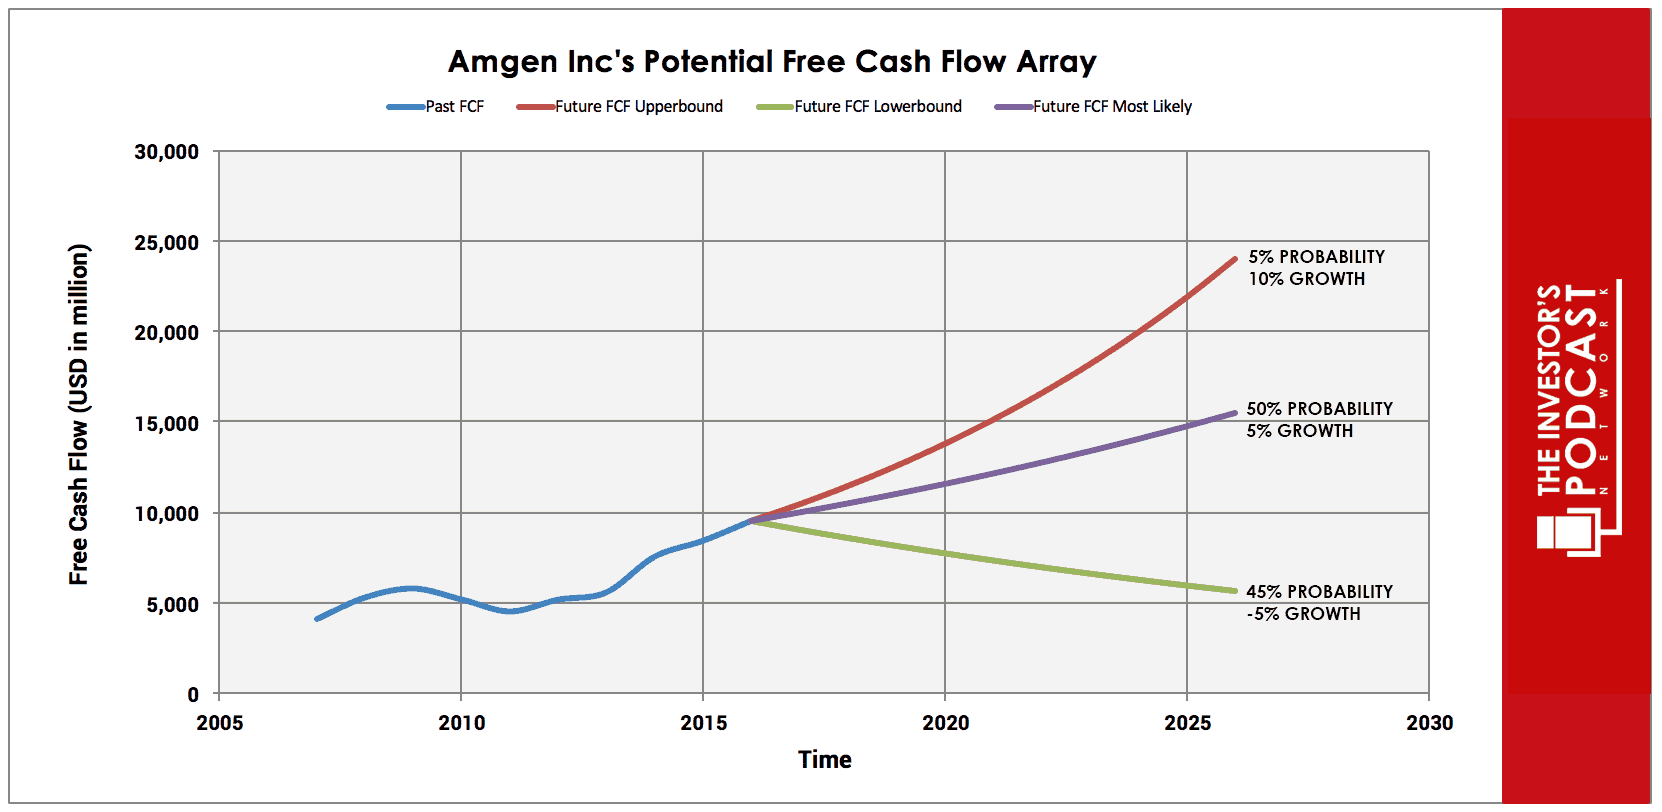
As one can see, the company’s free cash flow has been on a relatively stable upward trend, growing at an annual rate of around 10% for the past ten years. This growth has been driven by an increase in demand for the company’s products as the occurrence of chronic illnesses rises. To determine Amgen Inc.’s intrinsic value, an estimate must be made of its potential future free cash flows. To build this estimate, there is an array of potential outcomes for future free cash flows in the graph below.

When examining the array of lines moving into the future, each one represents a certain probability of occurrence. The upper-bound line represents a 10% growth rate. This is based on the historical rate of growth in free cash flow and has been assigned a modest 5% probability of occurrence since Amgen Inc. has lost patent protection on its three biggest selling products and, despite reinvesting in the product lines, the future is still unknown.
The middle growth line represents a 5% growth rate. This is based on the 10-year historical revenue growth rate and assumes that Amgen Inc. can overcome regulatory and legal issues. This also presumes that Amgen Inc. can bring new products to the market in the next few years to compensate for the loss of patent protection on its three largest products, namely Enbrel, Neulasta, and Aranesp. Due to the current uncertainty, this scenario has been assigned a 50% probability of occurrence. It should be noted that the operating margin has not only managed to kept pace, it has also shown a strong upward trend.
The lower bound line represents a -5% growth rate in free cash flow growth and has been assigned a 45% probability of occurrence. This lower bound rate assumes that the company’s revenues enter a secular decline and that it fails to successfully compensate for this fact by bringing viable new products to market. Assuming these potential outcomes and corresponding cash flows are accurately represented, Amgen Inc. might be priced at a 7% annualized return if the company can be purchased at today’s price. We’ll now look at another valuation metric to see if it corresponds with this estimate.
Based on Amgen Inc.’s current earnings yield, which is the inverse of its EV/EBIT ratio, the company is projected to return around 8.53%. This is above the firm’s historical median average of 7.80% and its peer group median of 4.76%, suggesting that the company is undervalued relative to the industry and its historical average. Furthermore, on a simple P/E basis, Amgen Inc. currently trades at 15.85x versus an average of 29.02x for the Global Biotechnology Industry. Finally, we’ll look at Amgen Inc.’s P/S ratio relative to its net profit margin, a rule of thumb which is useful for estimating the price one should pay for a company relative to it what profit it generates from its revenues.

At present, Amgen Inc. has a (ttm) net profit margin of 35.5% and is trading at a P/S ratio of 5.63. This suggests that the company is undervalued relative to the net profit it derives from its revenues. Taking all these points into consideration, it seems reasonable to assume that Amgen Inc. is trading at a discount to fair value. Furthermore, the company may return around 7-8% at the current price if the estimated free cash flows are achieved. Now, let’s discuss how and why these free cash flows could be realized.
THE COMPETITIVE ADVANTAGE OF AMGEN INC.
Amgen Inc. has various competitive advantages outlined below.
- Efficiency. Amgen Inc. is a leader in the manufacturing of biologics and is constantly seeking to strengthen its position. An example of this it the company’s recent move to improve its manufacturing network with the creation of a new plant in Singapore. According to Amgen Inc.’s 2016 Annual report, the plant was “constructed in less than half the time and at less than a quarter of the cost of a traditional facility.” These efficiencies of scale enable Amgen Inc. to outperform its peers on some key performance metrics outlined in the table below.

- Low-Cost Amgen Inc.’s operating margin of 44% is amongst the top 3% in the global biotechnology industry. This low-cost operator advantage means that the company can earn higher returns than its rivals through the development of branded biosimilars (pharmaceuticals which are not protected by patent). To differentiate them from generic alternatives, Amgen is creating its own branded versions at a lower cost than its competitors.
- High Barriers to Entry. The biotechnology industry, being highly regulated, limits the number of new entrants likely to enter the space. Since the cost of both capital and time is so high, the commercial viability of mounting a serious challenge for market share is very low.
- Oligopoly Status. Oligopolies are a common feature of the biopharmaceuticals market, and Amgen Inc. is currently one of the top players in terms of market share across several product lines. These include a 38.2% share of Neulasta sales and an 11.6% share of Aranesp sales. The TIP Community should note that Amgen Inc.’s market share will likely decline due to patent expiry. The possibility remains that the company’s new pipeline of pharmaceuticals will facilitate growth in new segments.
AMGEN INC.’S RISKS
Now that Amgen Inc.’s competitive advantages have been considered, let’s look at some of the risk factors which could impair my assumptions of investment return.
- While Amgen Inc. possesses multiple competitive advantages, there still exists the possibility that one of its rivals could mount a challenge to erode its competitive advantages and move on its market share. It should be noted that some of these competitors possess both their competitive advantages and ample capital to mount a serious challenge.
- At present, Amgen Inc.’s three largest products account for 55% of its revenues. The revenues from these products have begun to decline in the recent quarters as they no longer possess patent protection. If the company fails to secure patent protection and regulatory approval of new products or to produce viable branded biosimilars, revenues and cash flows may enter a secular decline.
- The emergence of a serious economic crisis similar to that witnessed in 2008 could materially impact the company’s revenues and profits, leading to lower growth in the coming years. While Amgen Inc. possesses numerous competitive advantages, an economic downturn would likely be detrimental to the firm.
- The risks of legal action for infringement of patents, breach of contract, or breach of government regulations is common in the Biotechnology market. The possibility exists that Amgen Inc. may face such action in the future which could materially impact its cash flows.
OPPORTUNITY COSTS
Whenever an investment is considered, one must compare it to any alternatives to weigh up the opportunity cost. At present, 10-year treasuries are yielding 2.37%. If we take inflation into account, the real return is likely to be closer to 1%. The S&P 500 Index is currently trading at a Shiller P/E of x 31.4 and, at present, is likely to return around 2-3%. Amgen Inc. appears to be trading below fair value and thus should offer a higher rate of return than both U.S. Treasuries and the S&P 500 Index. There are, however, other individual stocks to be found which may offer a more favorable return relative to the risk profile.

MACRO FACTORS
Investors must consider macroeconomic factors that may impact economic and market performance as this could influence investment returns. At present, the S&P is priced at a Shiller P/E of 31.4. This is around 87% higher than the historical average of 16.8, suggesting markets are at elevated levels. U.S. unemployment figures are at a 30-year low, suggesting that the current business cycle is nearing its peak. U.S. private debt/GDP currently stands at 199.6% and is at its highest point since the last financial crisis which prompted private sector deleveraging in 2009.
SUMMARY
The future for Amgen Inc. looks uncertain at present. A major area of concern is the patent expiry on the company’s key products and the risk of secular decline in revenues and earnings should the firm fail to successfully bring new products to market. Management has been taking significant steps to cut costs which resulted in earnings growth and margin expansion in the third quarter of 2017. This is obviously not a long-term solution. To counter this, further cost-cutting is expected in 2018. But this may have a negative impact on R&D and marketing in the coming years. Whether there will be reinvestments in new product lines, the loss of key patents is still up in the air and is still the main reason for the relatively low valuation compared to the market.
Management has a reasonable track record of being both shareholder-friendly and shrewd capital allocators. The company has returned $6 Billion of capital to shareholders through dividends and share repurchases in FY2016 and has raised dividends per share by 27% over the previous year. Furthermore, the company has managed to achieve an average FCF/Sales and a Return on Equity of 33.72% and 21.9% respectively during the last ten years. It should, however, be noted that the company currently carries a significant debt load with a D/E ratio of 1.1. This is above the Industry average of 0.9 and suggests the firm has been aggressive in financing its growth through debt. This is somewhat offset by the fact that the company has a strong liquidity position with a current and quick ratio of 6.07 and 5.46 respectively.
At present, Amgen Inc. appears undervalued with an estimated return of around 7%. While the company’s stock price is currently trading at a discount to fair value, there exist multiple issues of concern which must be carefully considered by investors.
To learn more about intrinsic value, check out our comprehensive guide to calculating the intrinsic value of stocks.


