TIP Academy
TIP Academy
Bill Gates
Stock Portfolio
Bill Gates
Stock Portfolio
Below is the current stock portfolio and sector weightings of Bill Gates. This information includes his number of shares, portfolio weight, and the latest value of his stock picks to date. Note: The data presented here are updated every quarter.
Below is the current stock portfolio and sector weightings of Bill Gates. This information includes his number of shares, portfolio weight, and the latest value of his stock picks to date. Note: The data presented here are updated every quarter.

Stock Picks:
Total Value:
TIP FINANCE
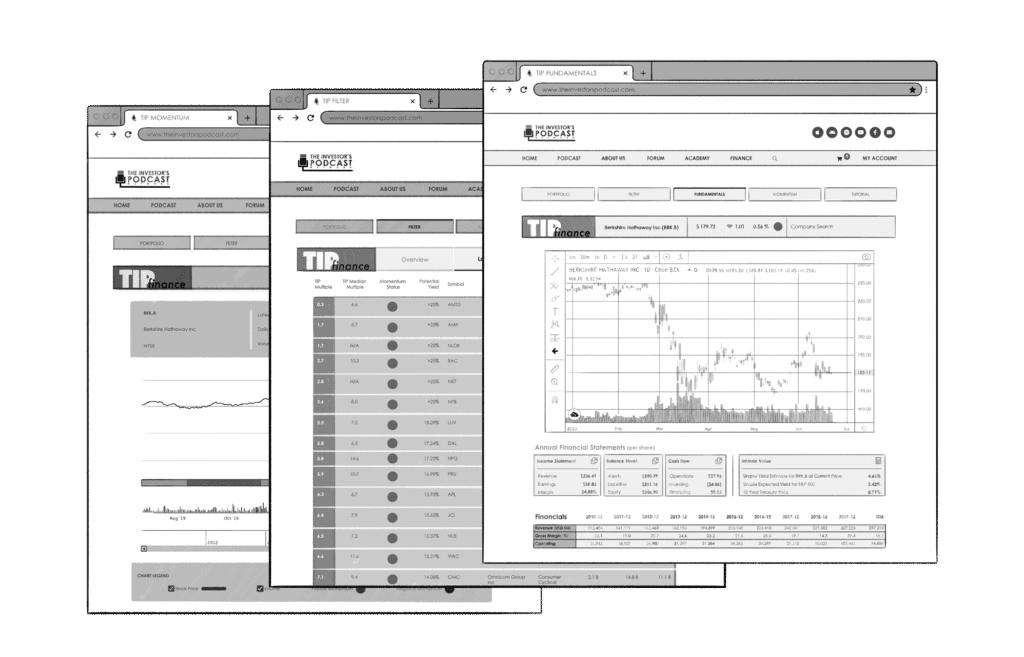
TIP Finance is a great way to track your own portfolio, to monitor changes to legend investors’ investments, and for finding your next great stock pick and calculating its intrinsic value. Plus so much more! Start using TIP Finance today (for free) to become a better investor like thousands of others already have.
TIP FINANCE
TIP Finance is a great way to track your own portfolio, to monitor changes to legend investors’ investments, and for finding your next great stock pick and calculating its intrinsic value. Plus so much more! Start using TIP Finance today (for free) to become a better investor like thousands of others already have.
TIP Finance is a great way to track your own portfolio, to monitor changes to legend investors’ investments, and for finding your next great stock pick and calculating its intrinsic value.
Plus so much more!
Start using TIP Finance today (for free) to become a better investor like thousands of others already have.
SECTOR WEIGHTINGS (%)
SECTOR WEIGHTINGS (%)
Get smarter about valuing businesses in just a few minutes each week.
Get the weekly email that makes understanding intrinsic value
easy and enjoyable, for free.
CURRENT PORTFOLIO
(As of February 17, 2026)
| Ticker | Company | % Portfolio | Number of Shares | Value ($1000) |
|---|---|---|---|---|
| BRK.B | Berkshire Hathaway Inc Del | 27.59% | 19,406 | 9,754,809,925 |
| WM | Waste Mgmt Inc Del | 17.98% | 28,934 | 6,357,164,720 |
| CNI | Canadian Natl Ry Co | 14.49% | 51,826 | 5,123,077,796 |
| MSFT | Microsoft Corp | 10.52% | 7,691 | 3,719,621,529 |
| CAT | Caterpillar Inc | 10.29% | 6,353 | 3,639,794,852 |
| DE | Deere Co | 4.68% | 3,557 | 1,656,208,475 |
| ECL | Ecolab Inc | 3.87% | 5,218 | 1,369,840,911 |
| WMT | Walmart Inc | 2.64% | 8,390 | 934,783,043 |
| FDX | Fedex Corp | 1.95% | 2,384 | 688,746,807 |
| KOF | Coca Cola Femsa Sab De Cv | 1.66% | 6,214 | 588,596,036 |
| WCN | Waste Connections Inc | 1.01% | 2,039 | 357,589,728 |
| CPNG | Coupang Inc | 0.62% | 9,248 | 218,161,382 |
| MSGS | Madison Square Grdn Sprt Cor | 0.43% | 592 | 153,225,812 |
| SDGR | Schrodinger Inc | 0.35% | 6,981 | 124,832,152 |
| WST | West Pharmaceutical Svsc Inc | 0.35% | 444 | 122,299,730 |
| PCAR | Paccar Inc | 0.31% | 1,000 | 109,510,000 |
| BUD | Anheuser Busch Inbev Sa Nv | 0.31% | 1,703 | 109,060,120 |
| MCD | Mcdonalds Corp | 0.29% | 334 | 102,355,487 |
| DHR | Danaher Corporation | 0.24% | 373 | 85,387,160 |
| KHC | Kraft Heinz Co | 0.17% | 2,472 | 59,960,550 |
| -–- | Others | 0.24% | 2,709 | 85,067,320 |
| -–- | Asset Under Management | 100.00% | 167,876 | 35,360,093,535 |

COURSES & TOOLS
Enjoy an abunance of materials and exclusive tools that can help you throught your investing journey!